5 restaurant KPIs worth tracking every week

If you only look at daily revenue, you are seeing just part of the picture. A restaurant can have a full dining room and plenty of orders while still losing money because of poorly priced menu items, excessive labour costs or expensive customer acquisition. That is why it is worth reviewing a few simple KPIs once a week and comparing them with previous periods.
This does not mean creating complex financial reports. In a small or medium-sized restaurant, it is often enough to calculate a few figures regularly, understand what affects them and react before the problem becomes visible in your bank account.
1. Food cost — how much your ingredients cost
Food cost shows what proportion of a dish's sales or total food sales is spent on ingredients. It is one of the basic restaurant KPIs because even small changes in ingredient prices can affect menu profitability.
How do you calculate food cost?
The basic formula is:
Food cost = cost of ingredients used / sales revenue × 100%
Example: assume that over one week a restaurant sold dishes worth PLN 20,000 net and the cost of the ingredients used was PLN 6,000.
6,000 / 20,000 × 100% = 30%
In this example, the food cost for the week is 30%.
You can calculate it for the whole restaurant, but analysing individual dishes provides even more useful information. This lets you see which items are priced well and which sell frequently but leave only a small margin.
How should you interpret the result?
There is no single correct level for every restaurant. In practice, indicative ranges of around 25–35% are often mentioned, but they should not be treated as a universal benchmark. A pizzeria, burger restaurant, café and restaurant using expensive premium ingredients can have completely different cost structures.
The trend is more important than the number itself. If your food cost stayed at a similar level for several weeks and suddenly rises, check:
- whether the prices of key ingredients have increased,
- whether portions have become larger than specified in the recipe,
- whether the amount of food being thrown away is increasing,
- whether promotions are reducing selling prices too much,
- whether your menu prices are still up to date.
If some of the problem comes from product waste, the article how to reduce restaurant food waste may be useful.
What should you do if food cost is too high?
First, identify which products and dishes are driving the increase. Do not automatically raise prices across the whole menu. Sometimes the problem concerns only a few ingredients or one group of dishes.
Example: on Friday evening, you sell a large number of dishes containing one ingredient that is becoming more expensive. Instead of changing every price, you can look for an alternative ingredient, negotiate the purchase price, adjust the portion size in line with the recipe or recalculate the price of that specific menu item.
2. Labour cost and prime cost
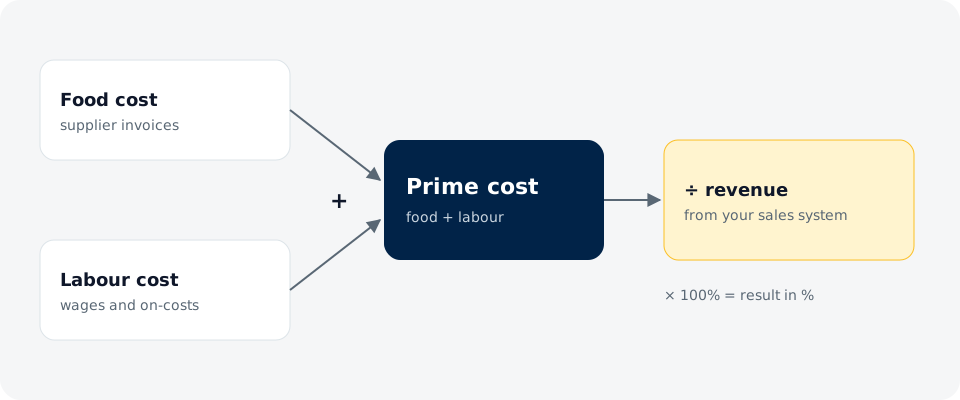
Labour cost shows what proportion of sales is absorbed by wages and associated employment costs. An even more useful figure can be prime cost, which combines ingredient costs and labour costs.
How do you calculate labour cost?
Labour cost = total employee cost / revenue × 100%
Example: assume that weekly revenue was PLN 30,000 and labour costs attributable to that period were PLN 9,000.
9,000 / 30,000 × 100% = 30%
In this example, labour cost represents 30% of revenue.
How do you calculate prime cost?
Prime cost = ingredient cost + labour cost
You can also express it as a percentage:
Prime cost % = (ingredient cost + labour cost) / revenue × 100%
Assume that in the same week ingredient costs were PLN 8,000, labour costs were PLN 9,000 and revenue was PLN 30,000.
(8,000 + 9,000) / 30,000 × 100% = 56.7%
This does not automatically mean the result is good or bad. It has to be considered alongside premises costs, energy, marketing, taxes, financing and other expenses.
How should you interpret the result?
If labour cost increases, do not immediately assume that you need to cut staff hours. First check whether the problem comes from higher costs or lower sales.
Example: on Monday and Tuesday you schedule the same number of staff as at the weekend, even though sales are significantly lower. In that case, the problem may be that staffing levels do not match customer traffic. On the other hand, at 19:00 on Friday an additional member of staff may be necessary even if they temporarily increase labour cost, because without them the kitchen and front of house may stop operating efficiently.
What should you do if labour cost is too high?
- compare sales and the number of orders by day and hour,
- check whether the rota matches the actual workload,
- separate regular working hours from overtime and additional shifts,
- check whether organisational tasks are taking up too much staff time,
- compare similar weeks rather than individual days.
Ranedo does not calculate labour cost or prime cost. You need to obtain cost data from HR records, payroll or your own reports. You can, however, combine the sales side with data on orders and revenue.
3. Average bill or order value
Average order value shows how much a customer spends on average or the average value of an order in a particular sales channel. It is a simple KPI that helps you assess your sales mix, the effectiveness of extras and meal deals, and changes to the menu.
How do you calculate average order value?
Average order value = revenue / number of orders
Example: assume that weekly revenue from orders was PLN 24,000 and the restaurant handled 400 orders.
24,000 / 400 = PLN 60
In this example, the average order value is PLN 60.
How should you interpret the result?
An increase in average order value does not always mean an improvement. If you have raised prices, the average may increase even if customers are ordering fewer items.
That is why it is worth comparing several figures at the same time:
- average order value,
- number of orders,
- total revenue,
- most popular dishes,
- sales channels.
Example: if average order value increases but the number of orders falls, check whether this is simply the result of price increases. If both figures are rising, the situation is different.
What should you do if the average bill is low?
Check whether customers have natural opportunities to add to their order. This is not about aggressively offering everything to everyone. A well-designed menu is often enough:
- sides for main courses,
- drinks that complement particular dishes,
- desserts,
- meal deals,
- different portion sizes,
- extra ingredients.
It is also worth analysing online orders separately. If this channel is important to you, you can read the article about online ordering conversion.
4. Table turnover
Table turnover shows how many times, during the period being analysed, one table was used by a new group of customers. In restaurants with table service, it helps assess how effectively the available seating capacity is being used.
How do you calculate table turnover?
One simple method is:
Table turnover = number of groups served / number of available tables
Example: assume that the restaurant has 10 tables and served 25 groups of customers during the evening service.
25 / 10 = 2.5
This gives an example average turnover of 2.5 groups per table during the analysed period.
You can also calculate turnover for a specific dining area, day of the week or time period.
How should you interpret the result?
Higher turnover is not always a goal in itself. In a café, a customer may stay at a table longer than in a restaurant focused on quick lunches. In an evening restaurant, a longer visit may be a natural part of the service model.
The KPI is most useful when you compare similar periods. If you have a queue every Friday between 18:00 and 21:00, but some tables spend a long time waiting for the bill, it may be worth looking for a bottleneck in the service process.
What should you do if table turnover is too low?
- check the time from customers sitting down to their order being taken,
- check food preparation times,
- see whether customers are waiting too long for the bill,
- analyse whether the dining room layout matches the size of customer groups,
- check whether reservations are blocking tables for too long before customers arrive.
The aim should not be to rush customers. The point is to identify delays caused by workflow rather than by the style of the restaurant.
5. Customer acquisition cost versus the value of a returning customer
Customer acquisition cost, often referred to as CAC, shows how much it costs to acquire one new customer who actually makes a purchase. In restaurants, it is particularly important to compare this cost with the value of a customer who returns regularly.
How do you calculate customer acquisition cost?
CAC = marketing spend / number of new customers acquired through those activities
Example: assume you spend PLN 1,000 on a campaign and can attribute 50 new customers to it.
1,000 / 50 = PLN 20
The example customer acquisition cost is PLN 20.
How do you compare CAC with the value of a returning customer?
Calculating full customer lifetime value can be more complex, but a small restaurant owner can start with a simple model.
Assume that an example returning customer visits the restaurant twice a month and spends an average of PLN 50. Over 6 months, that gives:
2 × PLN 50 × 6 months = PLN 600 in revenue
This is not profit. You still need to deduct ingredient costs, labour costs and other expenses. However, this calculation shows why it is worth looking not only at the cost of the first visit, but also at whether the customer returns.
What should you do if CAC is too high?
First, check whether you know which activities are actually bringing in new customers. If all marketing expenditure is grouped together, it is difficult to judge what is working.
It is worth analysing separately:
- paid campaigns,
- promotions for new customers,
- leaflets and local marketing materials,
- your own website and direct orders,
- activities aimed at existing customers.
If acquiring a new customer is expensive, encouraging repeat visits becomes even more important. A returning customer does not require you to pay the full acquisition cost again each time.
How can you combine these KPIs into one weekly report?
Do not analyse each KPI completely separately. Comparing them together gives you much more information.
Example: assume that in one week:
- revenue increases,
- average order value increases,
- food cost also increases,
- labour cost remains unchanged,
- the number of orders falls.
The increase in revenue alone might look positive. Once you compare all the data, however, you may find that you are selling fewer orders at higher prices while your ingredients are also becoming more expensive. That gives you a very different picture of the situation.
A useful weekly report might therefore include:
- revenue,
- number of orders,
- average order value,
- food cost,
- labour cost and prime cost,
- table turnover,
- customer acquisition cost,
- a short note on what changed compared with the previous week.
What data can you check in Ranedo?
Ranedo does not calculate food cost, labour cost or prime cost. This information has to come from purchase invoices, HR records, payroll or your own cost reports.
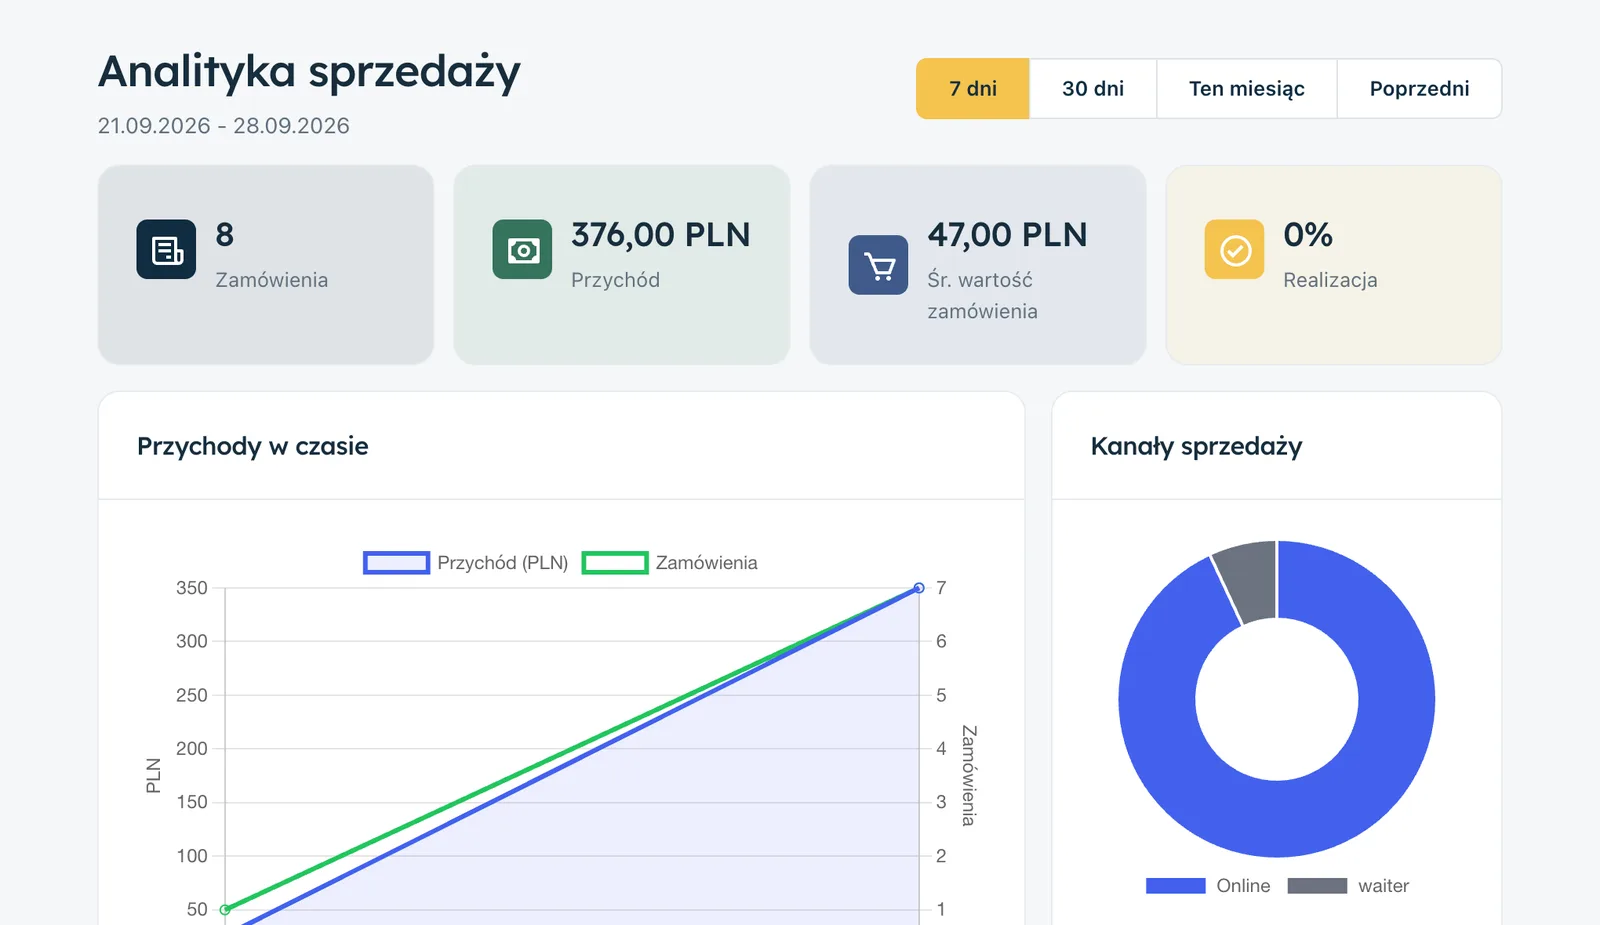
All Ranedo plans do, however, show the sales side: number of orders, revenue, average order value, most popular dishes, sales channels and busiest hours. Orders can also be exported to CSV and combined with other data in a spreadsheet.
This means you do not have to enter basic sales information manually. You can combine your cost data with results from the system and prepare your own weekly report.
You can find more information about analysing your restaurant's results in the restaurant results in Ranedo section.
Do not look for one perfect number
The biggest mistake is treating individual figures as universal benchmarks. Indicative ranges can provide a reference point, but every restaurant operates differently.
It is much more important to monitor trends. If your food cost stays at a similar level for several months and suddenly starts rising, that is a signal to investigate the cause. If your average order value falls for several weeks, it is also worth looking at changes in the menu, sales channels and customer behaviour.
The best approach is consistency. One report every week provides more value than a highly detailed analysis carried out once every few months.
Track your sales in one place
Ranedo sales analytics are available in all plans. You can check the number of orders, revenue, average order value, popular dishes, sales channels and busiest hours, then combine these figures with costs from your own reports.
You can view the Ranedo plans or create an account and use the free first month with all features included in your selected plan.
Frequently asked questions
How often should you calculate restaurant KPIs?
For most small and medium-sized restaurants, a weekly schedule is practical. It allows you to spot changes sooner than a monthly analysis while avoiding the need to prepare full reports every day.
Is a 30% food cost always good?
No. Indicative ranges of around 25–35% are often mentioned, but they are not a universal benchmark. The result has to be assessed in the context of the type of restaurant, its prices, labour costs and other expenses.
Does Ranedo calculate food cost and labour cost?
No. Data on purchases and employment costs needs to come from invoices, HR records or your own accounting. Ranedo provides sales data that you can compare with those costs.
What is the difference between labour cost and prime cost?
Labour cost covers expenses related to staff. Prime cost combines labour cost with ingredient cost, so it represents a larger proportion of a restaurant's core operating costs.
Which KPI is the most important?
There is no single KPI that is enough to assess a restaurant. It is best to analyse them together, because an increase or decrease in one figure often only makes sense when compared with revenue, the number of orders and costs.
Share this article: